Education
Case study: Redesign MindX E-learning lesson model to improve retention
Case study: Redesign MindX E-learning lesson model to improve retention
Apr 30, 2024
Apr 30, 2024
My role
Product Designer: Dam Khanh Hoang
Product Owner: Dam Khanh Hoang
Overview
Denise is an internal e-learning platform that empowers programming learners at MindX to complete their assignments. Tailored specifically for programming education, the platform offers a streamlined learning experience.
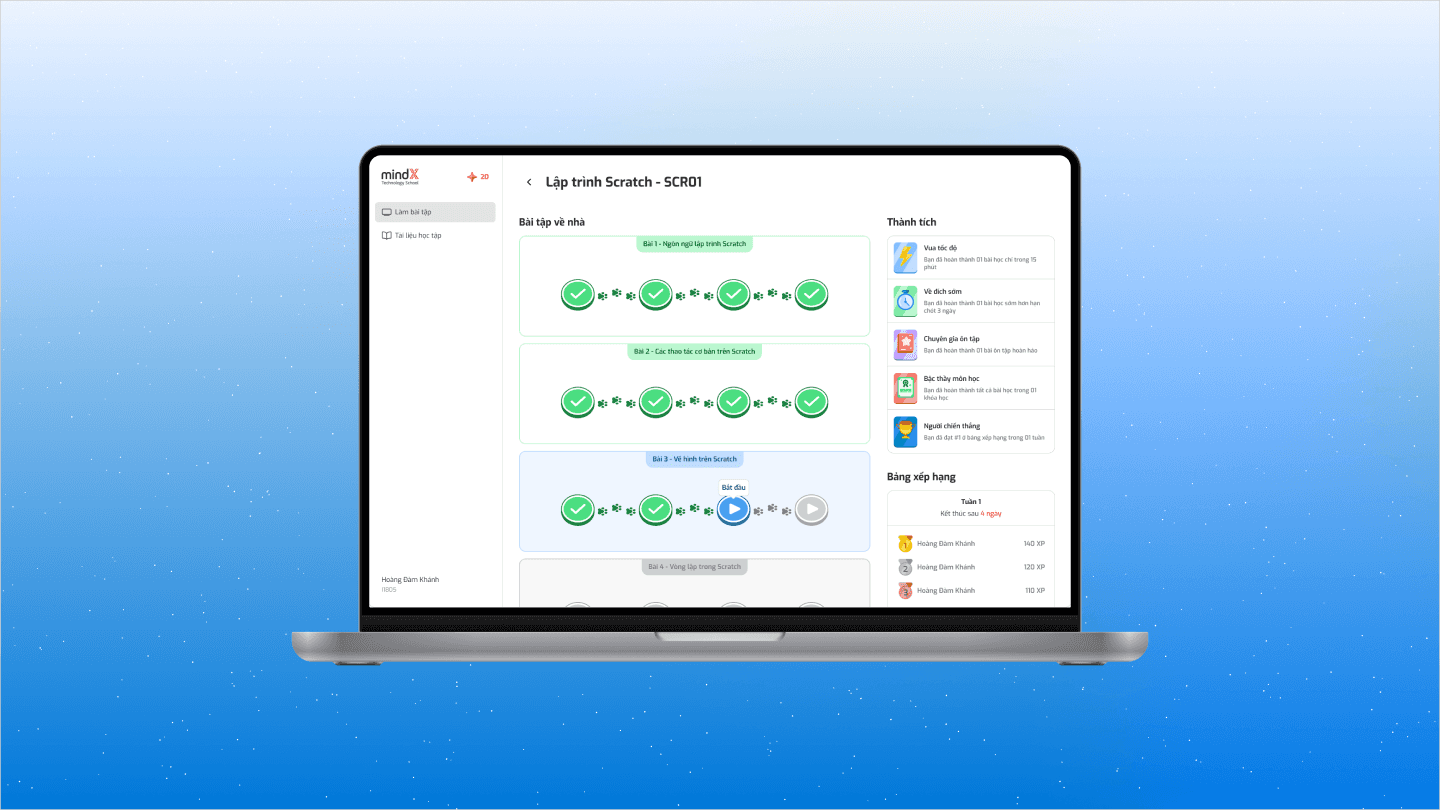


Context
After a successful pilot with 50 early adopters, Denise was expanded to 10 MindX centers and was then on track to onboard the next 500 weekly active users.
However, after three weeks of wider release, a concerning metric emerged: only 15% of students completed their initial lesson. This meant a significant drop-off rate, with 85% of students starting a lesson, engaging with some of the content, but ultimately abandoning it before completion.
Problem identification
We started to take a closer look at more detailed metrics.
FYI
Before we delve into the challenge, let's briefly explore the structure of our lessons.

Each lesson typically includes:
Review Quizzes: These quizzes, divided into two milestones, help students solidify their understanding of key concepts.
Practice Challenges: These challenges, also divided into two milestones, offer hands-on application. Students directly write code in an integrated editor or upload a pre-built file.
The numbers say…
To understand student behavior, we tracked their progress at key points within the learning journey. Here's what we discovered:
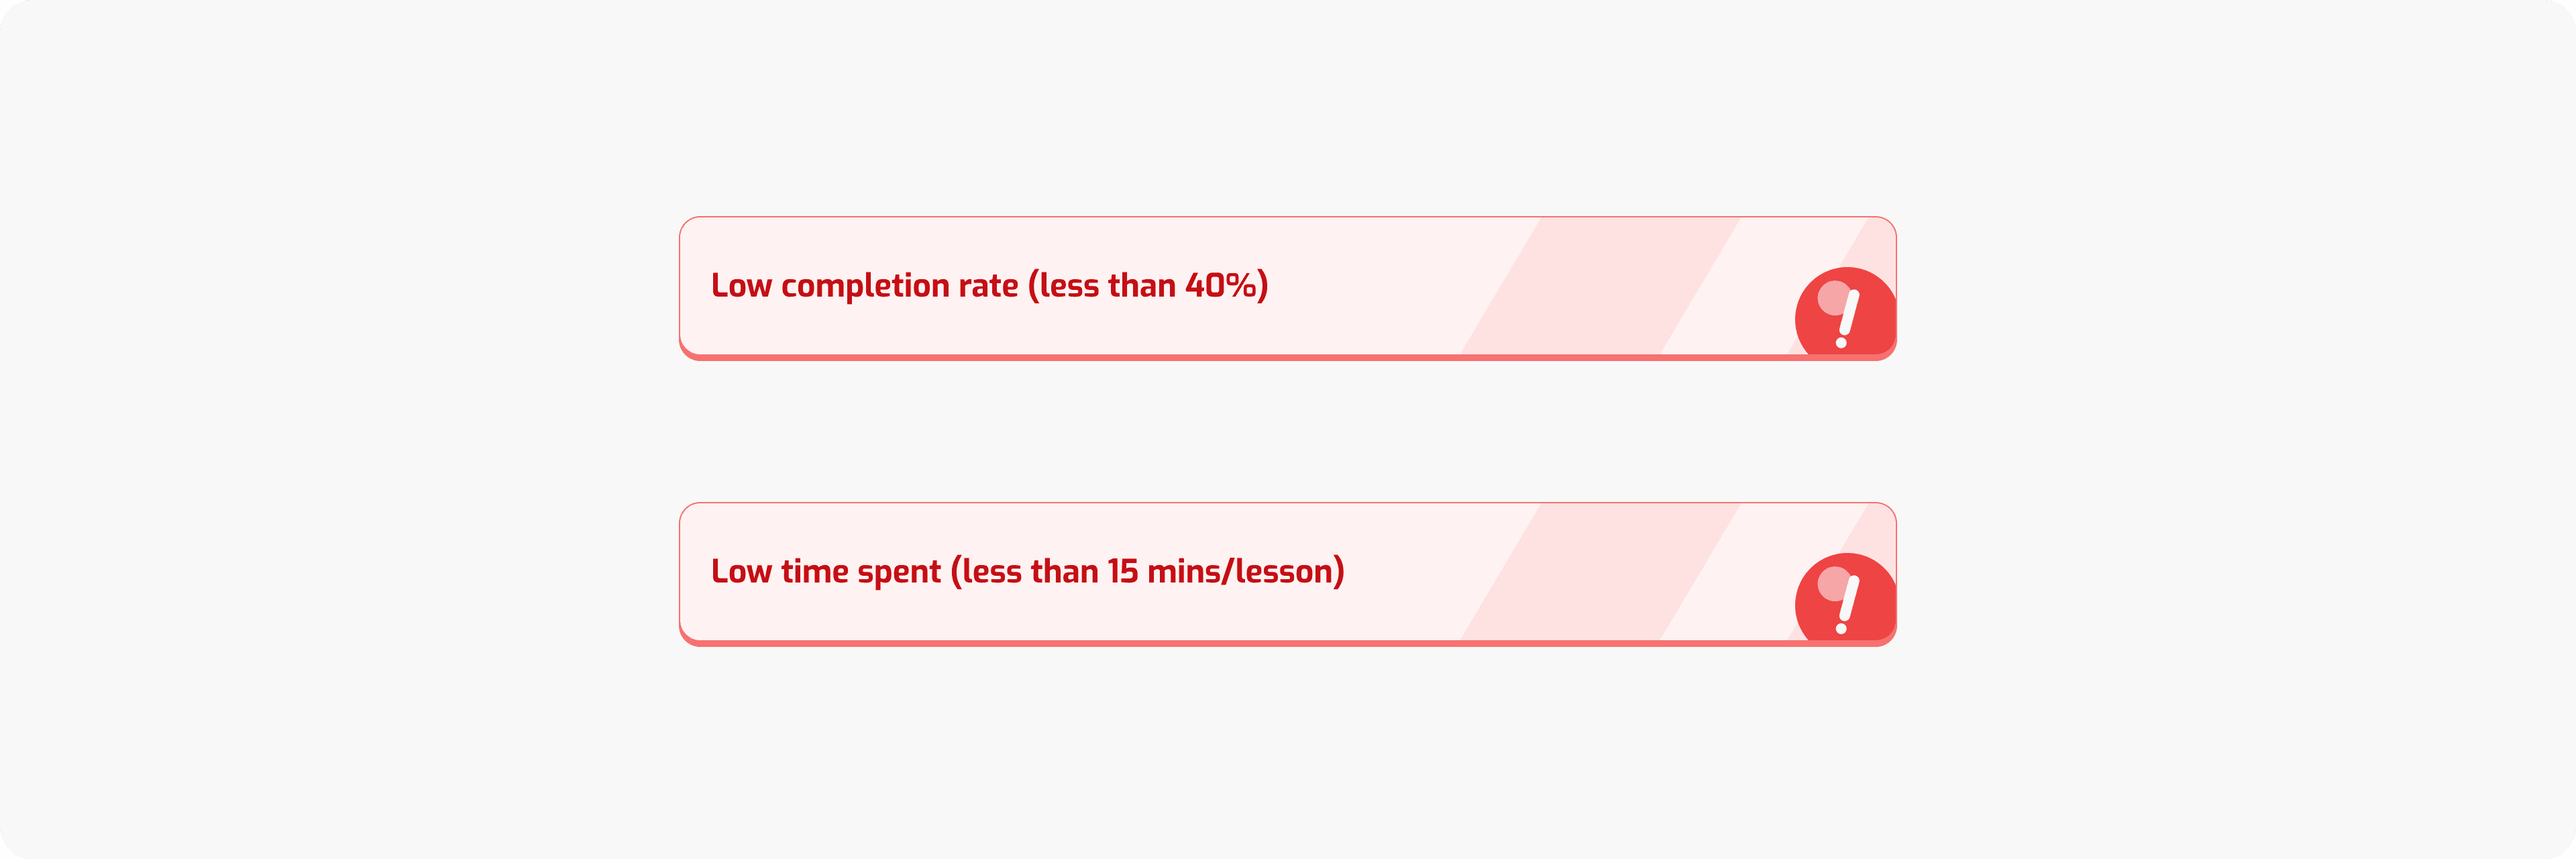
Milestone Completion: While nearly all students completed the first two milestones (CR42), engagement dropped significantly thereafter. The average completion rate for CR43 (practice milestones) dipped to around 40%, and for CR54, it fell further to 38%.
Time Spent: The average time spent per lesson across all students was 14.44 minutes. However, students who completed the entire lesson spent significantly more time, averaging 35.48 minutes.
Key Insights: This data suggests a decline in student interest, particularly during practice milestones. Interestingly, engagement seems to reset weekly, with similar completion rates across different lessons. Finally, the average time spent per lesson indicates that most students may not be dedicating enough time to complete the entire curriculum.
Other problems
Another issue was found when we surveyed students to validate the metrics above
While students acknowledged that both review quizzes and practice challenges contribute to their final grades, they perceived review tasks to be significantly easier. This perception led to a strategic behavior: many students prioritized completing the reviews, neglecting the practice challenges with lower perceived effort.
Design challenge
Goals & Metrics
Primary goal:
Increase the lessons' completion rate
Primary metrics:
Increase CR43 to 70-80% - We want 70-80% lessons having its first practice challenge started
Increase CR54 to 50-60% - We want 50-60% lessons having its second practice challenge started
Increase CRX6 to ~50% - We want around 50% lessons fully finished
Secondary goal:
Increase time spent on lessons
Secondary metrics:
Increase time spent on lessons to ~30 minutes - We want each lesson to be spent around 30 minutes on
Constraints
From stakeholders: The R&D department restricts changes to lesson content
From time pressure: This issue should be resolved within an US sized XL
Solution
I applied Fogg Behavior Model, which means Behavior = Motivation + Ability + Prompt, to approach this issues.

While a detailed discussion of Prompt is reserved for a separate case study, let's delve into the Ability factor.
Students are time-constrained
Time Constraints & Perception: Students at MindX prioritize other studies. Completing perceived long lessons (45 minutes) is a hurdle. Let's see the old design.
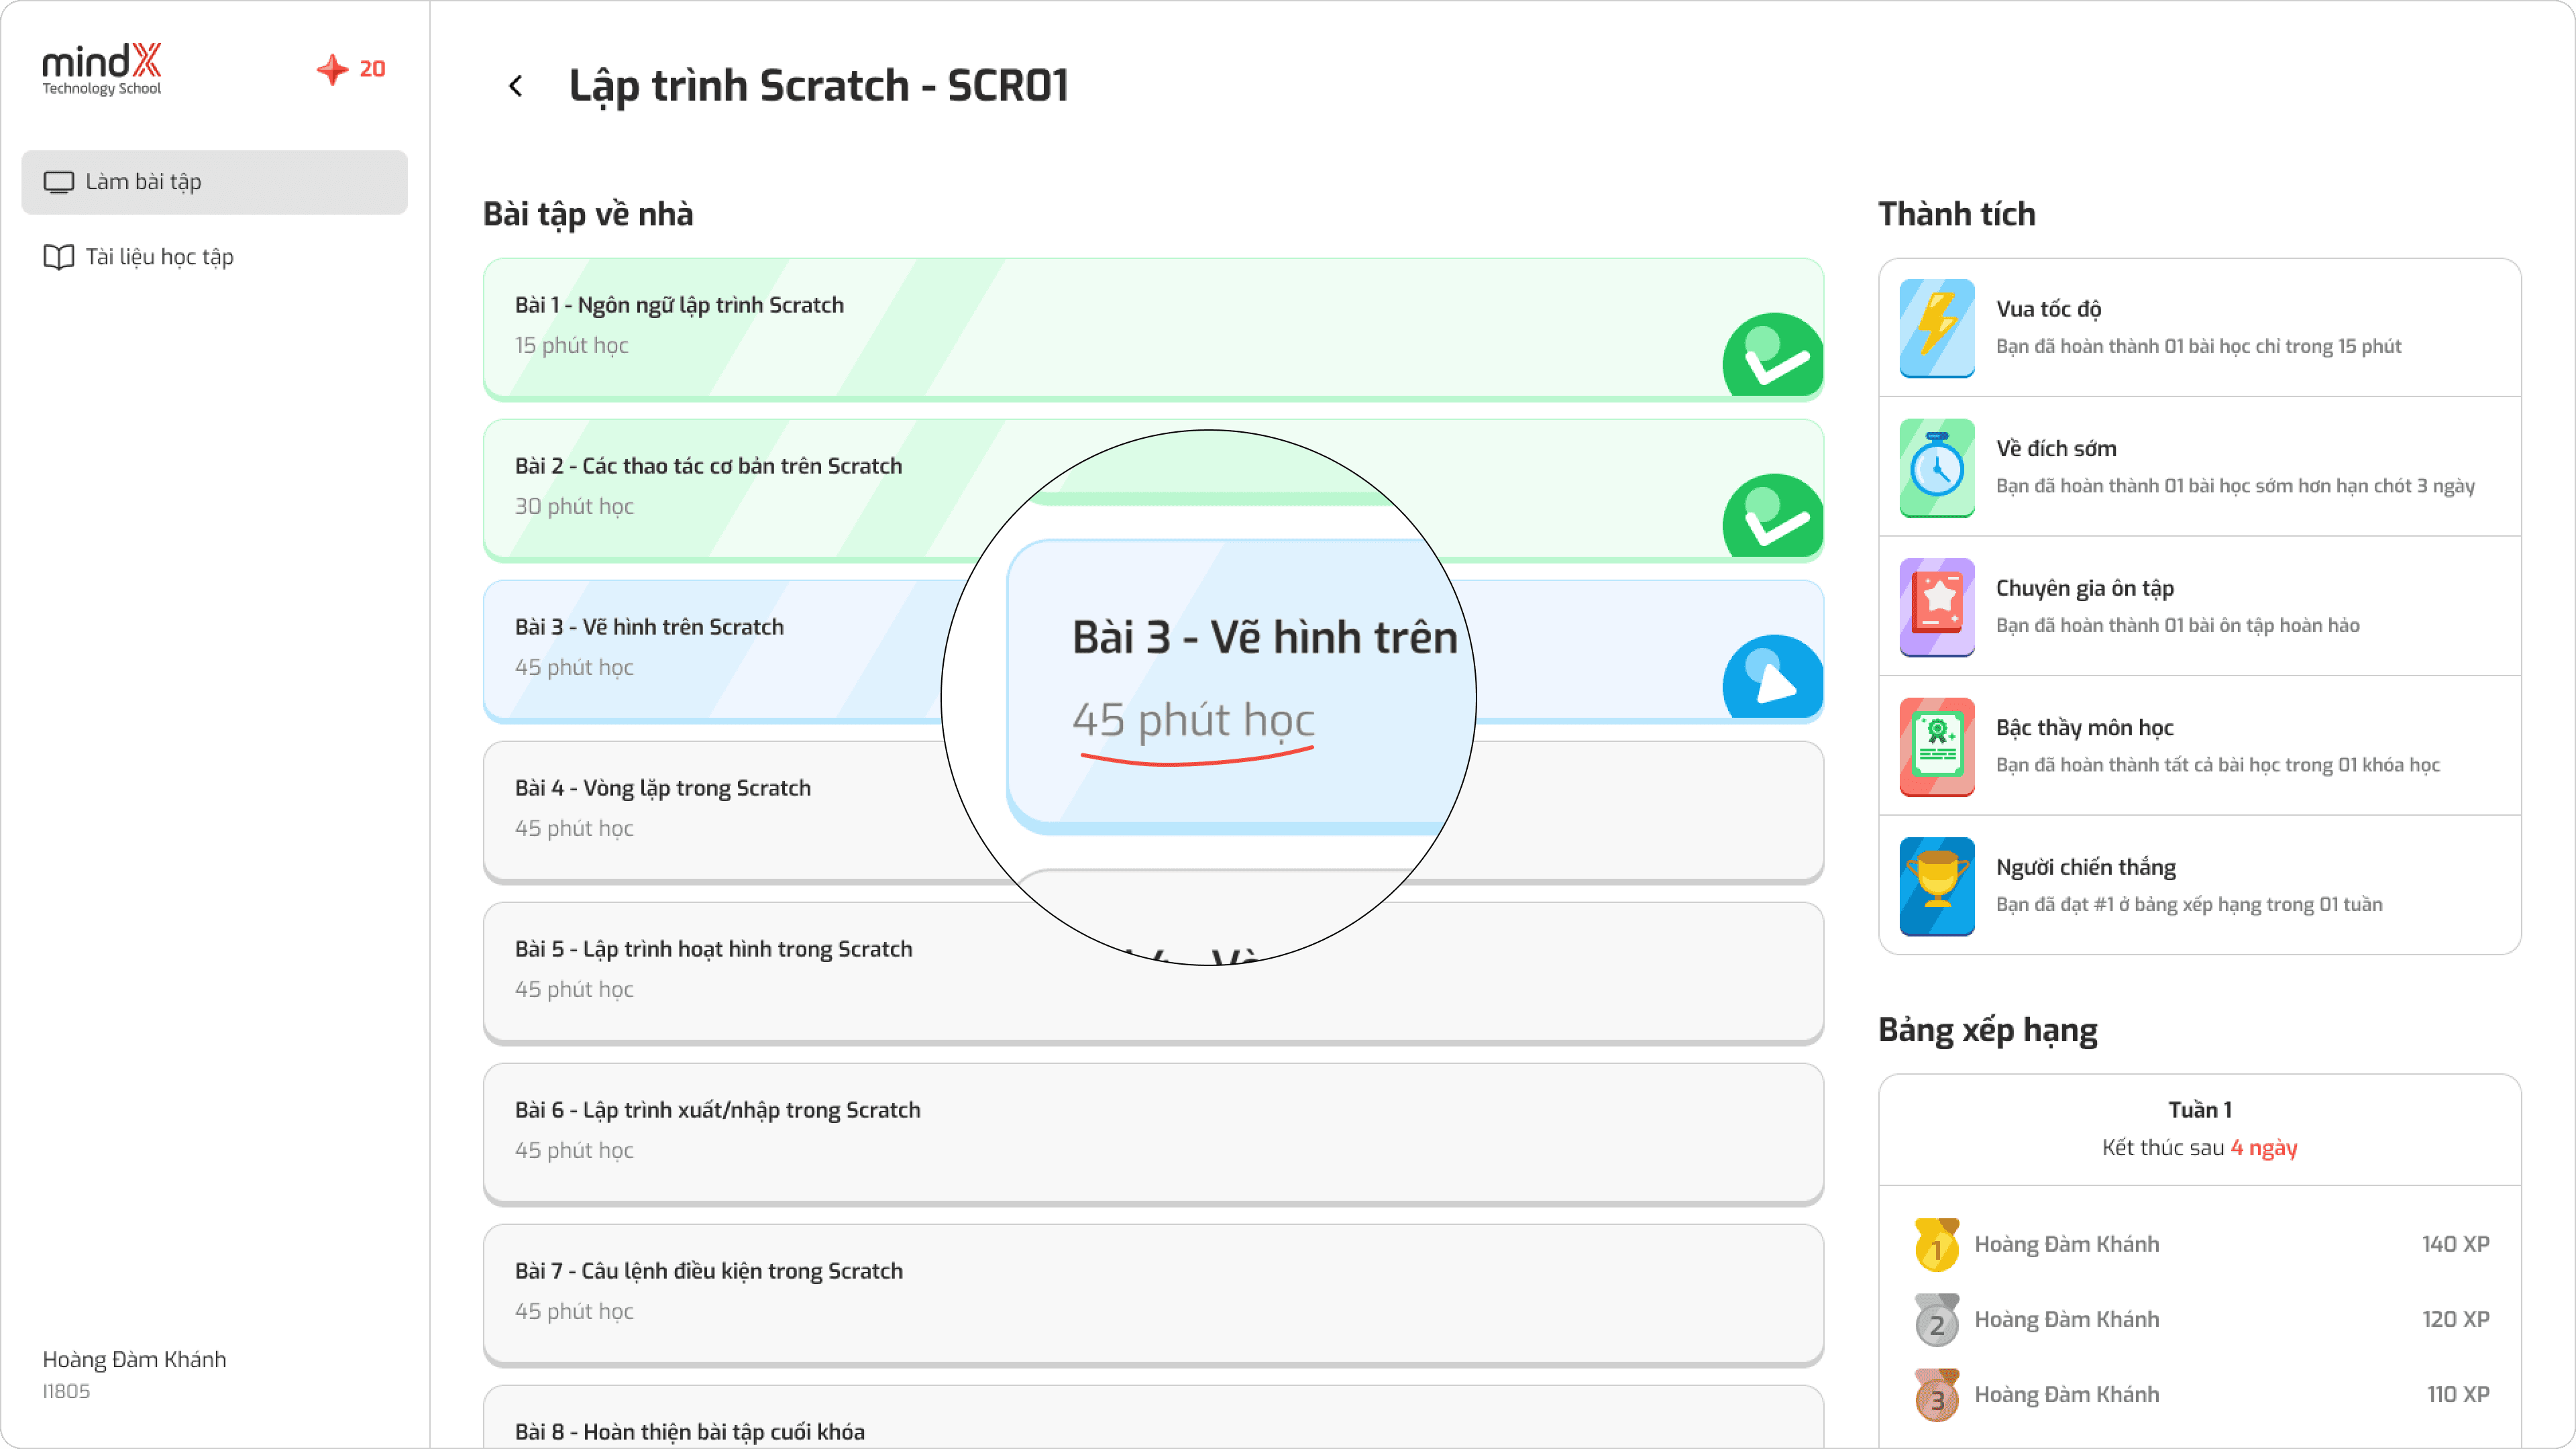
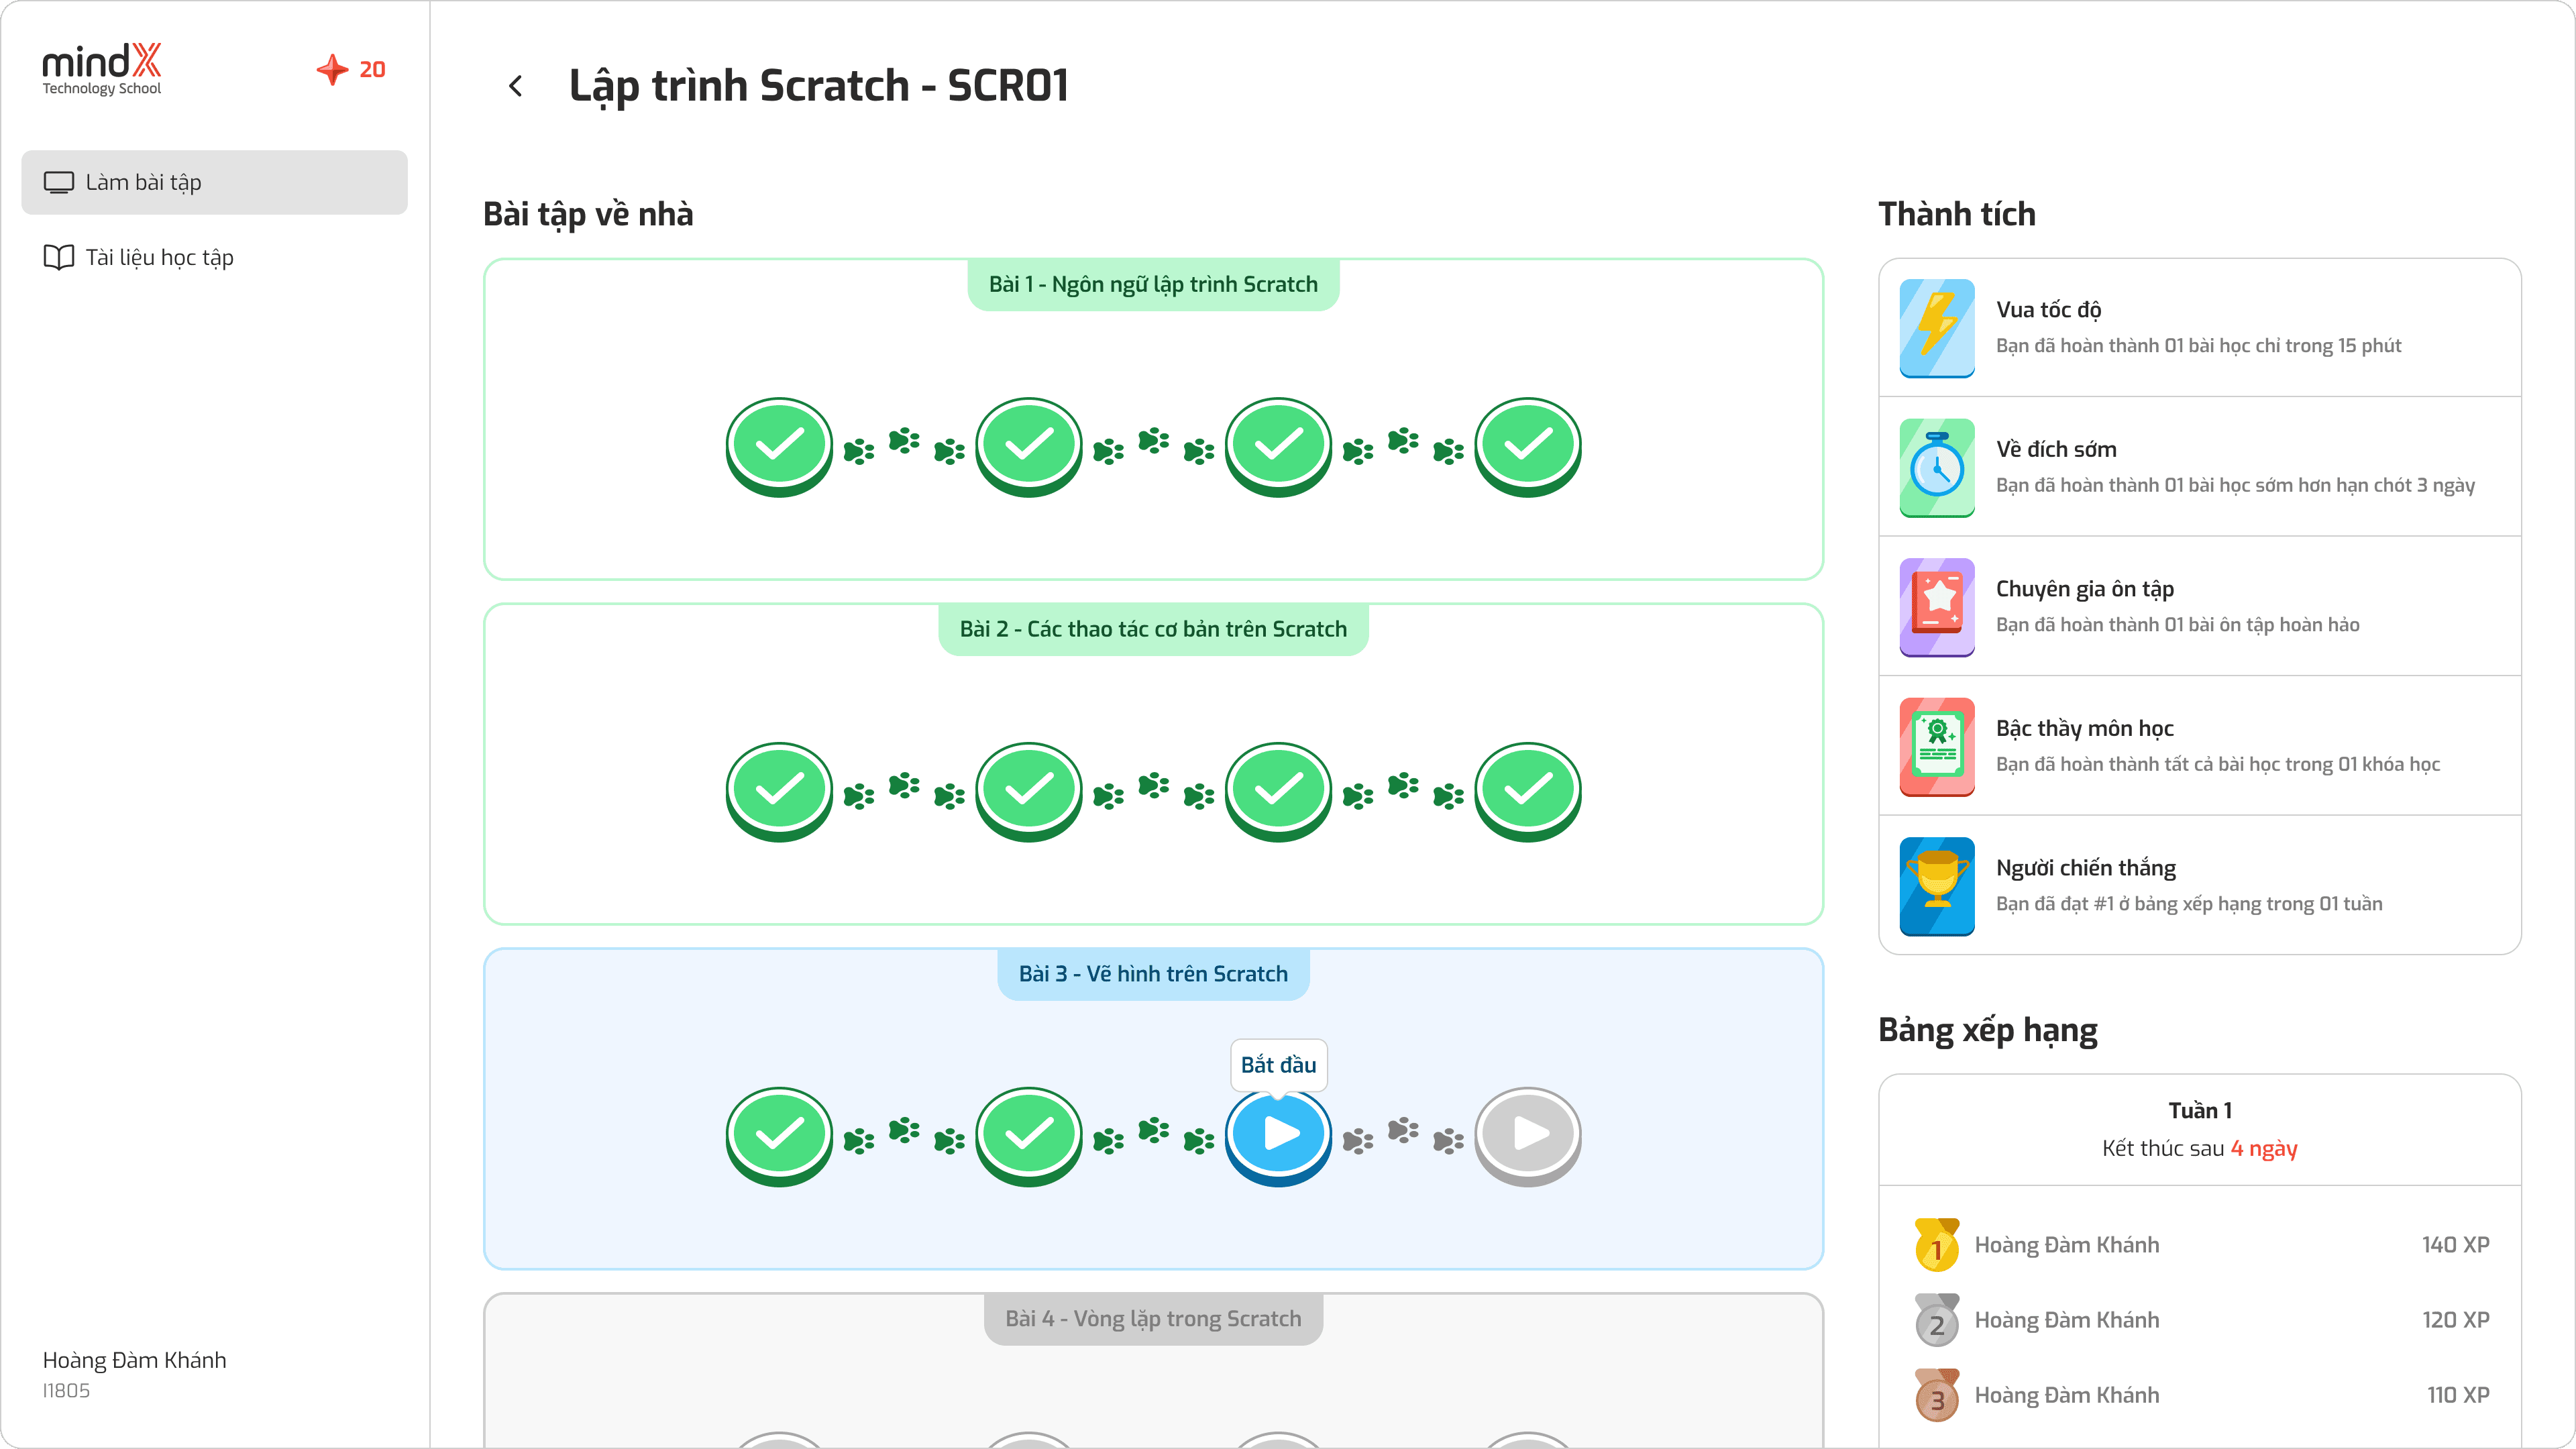
By splitting milestones into individual lessons, we aimed to:
Increase engagement: Leverage the observed "weekly reset" in student engagement.
Improve accessibility: Offer shorter, more manageable lesson sizes.
This structure is visualized below:
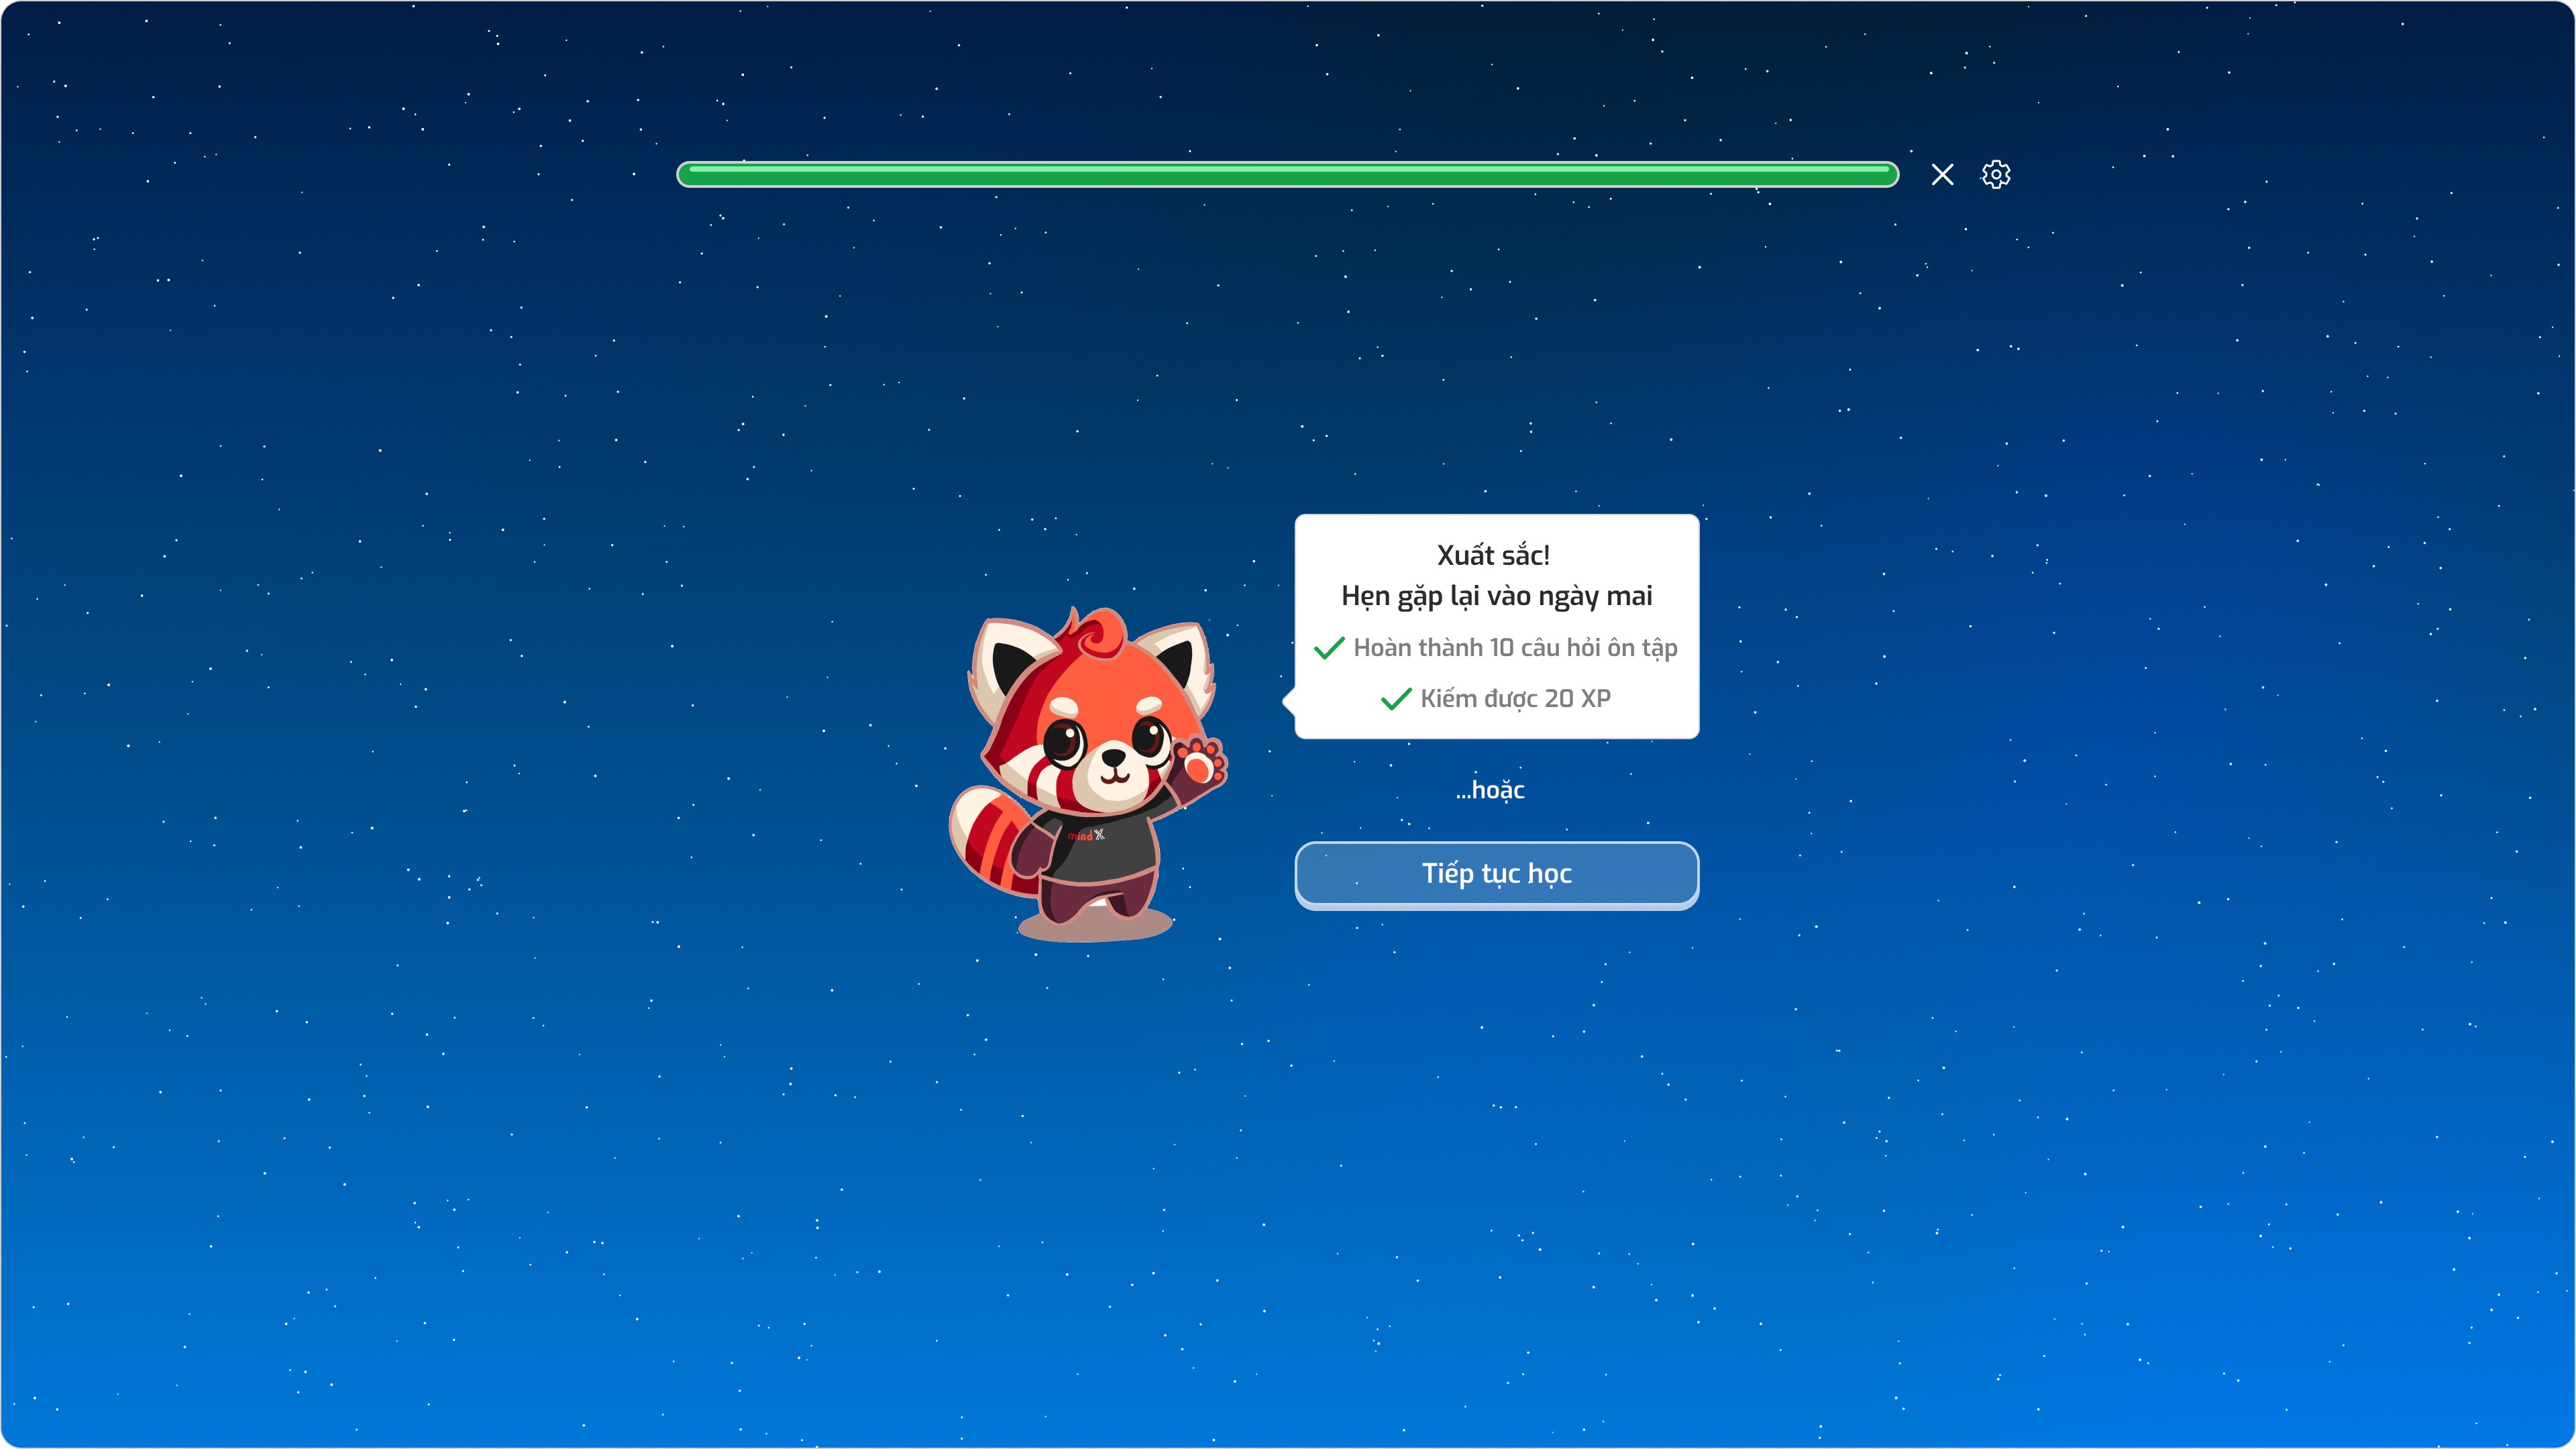
The practice challenges take high mental effort
High-Effort Practice & Encouraging Breaks:
Practice challenges demanded focused attention, taking an average student 15-20 minutes to complete. Recognizing this mental strain, we introduced "rest and return" prompts. This encouraged students to take breaks when needed, aligning with our company's belief: consistent practice, not marathon sessions, leads to mastery.
Now let's move to the Motivation side:
Students believe that review and practice tasks contribute equally to their final mark
Survey data revealed a disconnect: students perceived review tasks as easier, potentially leading to demotivation for the more effort-intensive practice challenges.
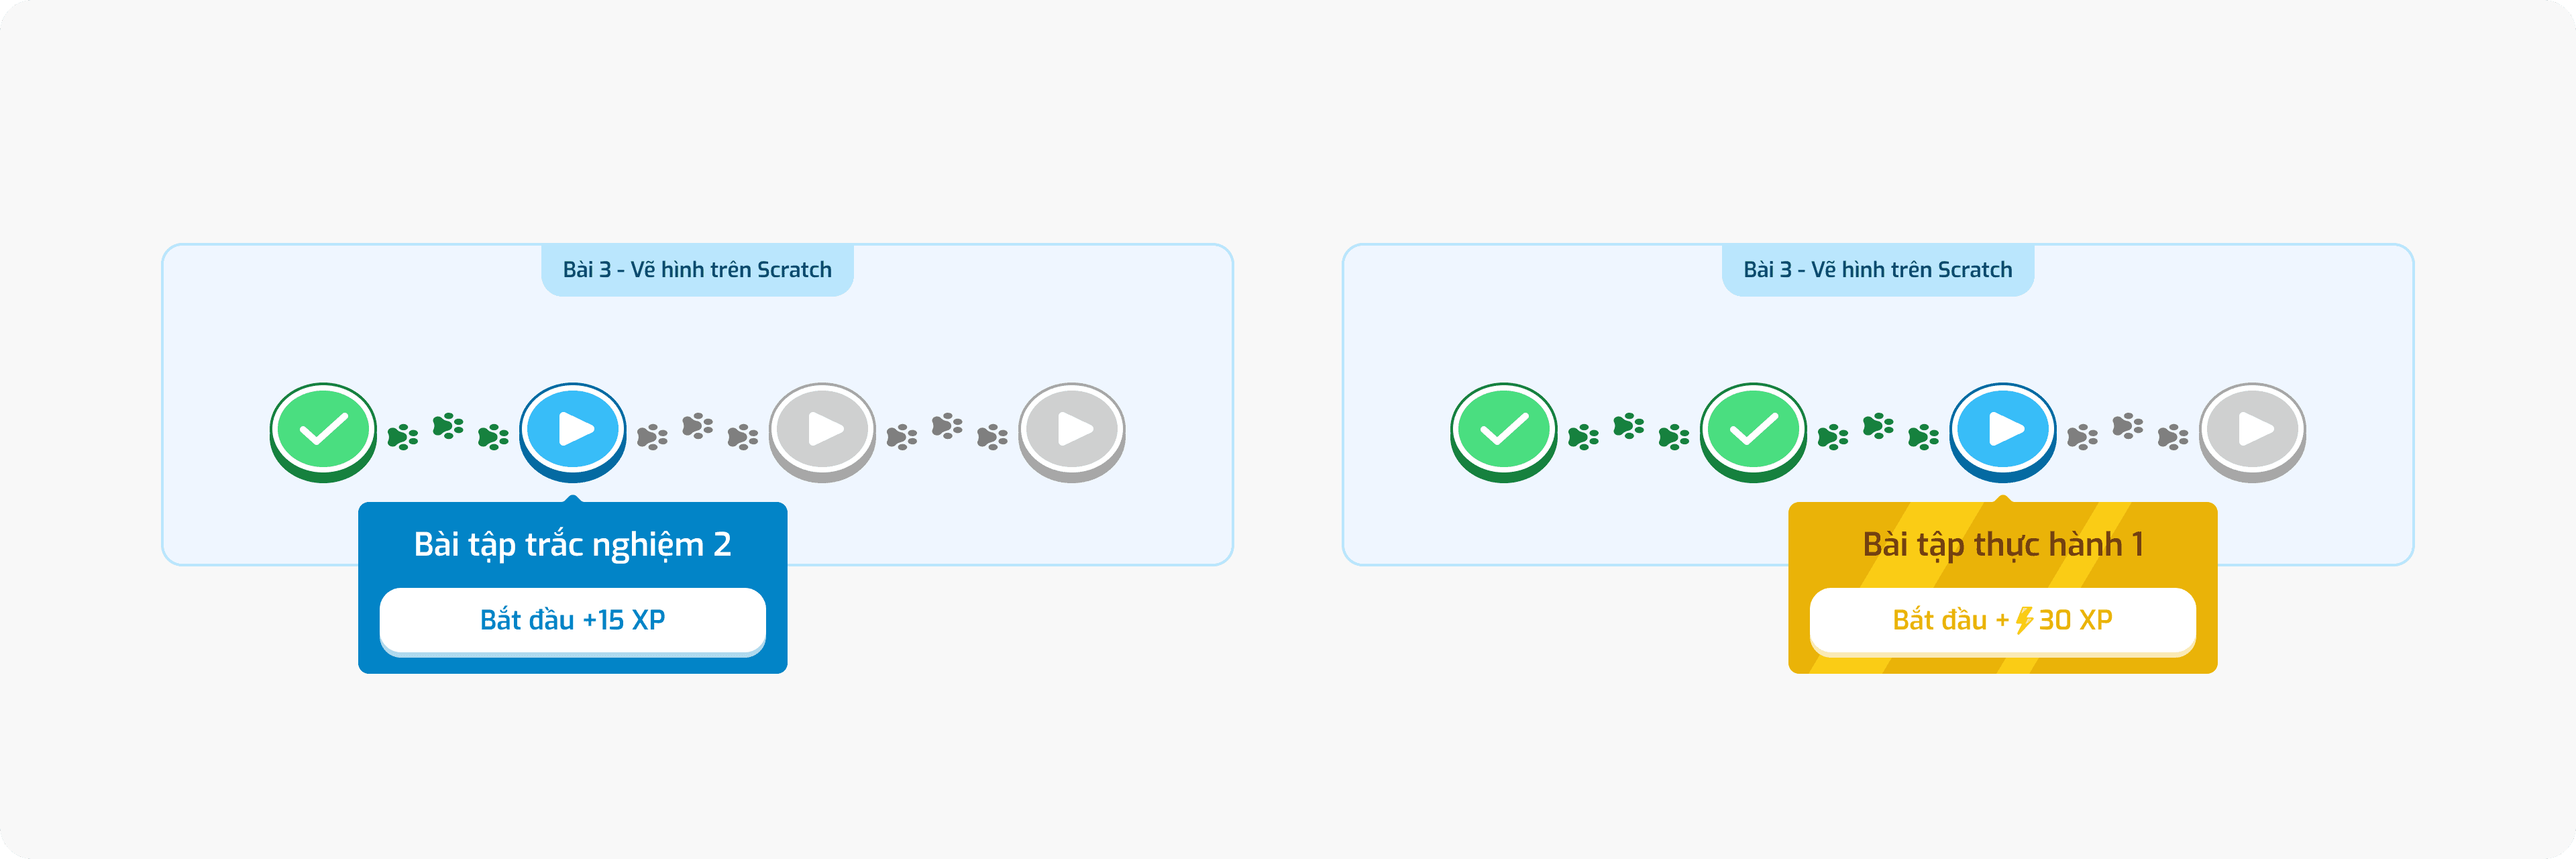
To address this, we leveraged the existing XP system, awarding greater XP rewards for completing practice challenges. This aligns effort with perceived value.
Results
3 weeks the release of this redesign, here is what we achieved:
Primary metrics:
Increase CR43 to 70-80% => 78.8% lessons having its first practice challenge started
Increase CR54 to 50-60% => 57% lessons having its second practice challenge started
Increase CRX6 to ~50% => 44.5% lessons fully finished
Secondary metrics:
Increase time spent on lessons to ~30 minutes => Average spent time increased to 28.43 minutes
Conclusion:
The implemented changes addressed two out of three primary goals for lesson completion rates (CR43 and CR54) and nearly achieved the time spent target. While the solution's long-term impact requires further observation, initial results demonstrate a positive influence on the learning experience and student outcomes.
Context
After a successful pilot with 50 early adopters, Denise was expanded to 10 MindX centers and was then on track to onboard the next 500 weekly active users.
However, after three weeks of wider release, a concerning metric emerged: only 15% of students completed their initial lesson. This meant a significant drop-off rate, with 85% of students starting a lesson, engaging with some of the content, but ultimately abandoning it before completion.
Problem identification
We started to take a closer look at more detailed metrics.
FYI
Before we delve into the challenge, let's briefly explore the structure of our lessons.

Each lesson typically includes:
Review Quizzes: These quizzes, divided into two milestones, help students solidify their understanding of key concepts.
Practice Challenges: These challenges, also divided into two milestones, offer hands-on application. Students directly write code in an integrated editor or upload a pre-built file.
The numbers say…

To understand student behavior, we tracked their progress at key points within the learning journey. Here's what we discovered:
Milestone Completion: While nearly all students completed the first two milestones (CR42), engagement dropped significantly thereafter. The average completion rate for CR43 (practice milestones) dipped to around 40%, and for CR54, it fell further to 38%.
Time Spent: The average time spent per lesson across all students was 14.44 minutes. However, students who completed the entire lesson spent significantly more time, averaging 35.48 minutes.
Key Insights: This data suggests a decline in student interest, particularly during practice milestones. Interestingly, engagement seems to reset weekly, with similar completion rates across different lessons. Finally, the average time spent per lesson indicates that most students may not be dedicating enough time to complete the entire curriculum.
Other problems
Another issue was found when we surveyed students to validate the metrics above
While students acknowledged that both review quizzes and practice challenges contribute to their final grades, they perceived review tasks to be significantly easier. This perception led to a strategic behavior: many students prioritized completing the reviews, neglecting the practice challenges with lower perceived effort.
Design challenge
Goals & Metrics
Primary goal:
Increase the lessons' completion rate
Primary metrics:
Increase CR43 to 70-80% - We want 70-80% lessons having its first practice challenge started
Increase CR54 to 50-60% - We want 50-60% lessons having its second practice challenge started
Increase CRX6 to ~50% - We want around 50% lessons fully finished
Secondary goal:
Increase time spent on lessons
Secondary metrics:
Increase time spent on lessons to ~30 minutes - We want each lesson to be spent around 30 minutes on
Constraints
From stakeholders: The R&D department restricts changes to lesson content
From time pressure: This issue should be resolved within an US sized XL
Solution
I applied Fogg Behavior Model, which means Behavior = Motivation + Ability + Prompt, to approach this issues.

While a detailed discussion of Prompt is reserved for a separate case study, let's delve into the Ability factor.
Students are time-constrained
Time Constraints & Perception: Students at MindX prioritize other studies. Completing perceived long lessons (45 minutes) is a hurdle. Let's see the old design.

By splitting milestones into individual lessons, we aimed to:
Increase engagement: Leverage the observed "weekly reset" in student engagement.
Improve accessibility: Offer shorter, more manageable lesson sizes.
This structure is visualized below:

The practice challenges take high mental effort
High-Effort Practice & Encouraging Breaks:
Practice challenges demanded focused attention, taking an average student 15-20 minutes to complete. Recognizing this mental strain, we introduced "rest and return" prompts. This encouraged students to take breaks when needed, aligning with our company's belief: consistent practice, not marathon sessions, leads to mastery.

Now let's move to the Motivation side:
Students believe that review and practice tasks contribute equally to their final mark
Survey data revealed a disconnect: students perceived review tasks as easier, potentially leading to demotivation for the more effort-intensive practice challenges.
To address this, we leveraged the existing XP system, awarding greater XP rewards for completing practice challenges. This aligns effort with perceived value.

Results
3 weeks the release of this redesign, here is what we achieved:
Primary metrics:
Increase CR43 to 70-80% => 78.8% lessons having its first practice challenge started
Increase CR54 to 50-60% => 57% lessons having its second practice challenge started
Increase CRX6 to ~50% => 44.5% lessons fully finished
Secondary metrics:
Increase time spent on lessons to ~30 minutes => Average spent time increased to 28.43 minutes
Conclusion:
The implemented changes addressed two out of three primary goals for lesson completion rates (CR43 and CR54) and nearly achieved the time spent target. While the solution's long-term impact requires further observation, initial results demonstrate a positive influence on the learning experience and student outcomes.